Ask your security teams to describe your organisation’s model-training environment and what do you hear back?
I’d bet there’s a lot of one word like answers, something along the lines of: “Databricks.” “SageMaker.” “Some GPUs we’ve got on AWS.”
Great, they just told you the platform names where your training work happens.
What they didn’t tell you are environment descriptions – descriptions that inform you about what components are running on those platforms, what those components can access, and which of them can influence a system that’s eventually deployed into production.
So let’s tackle those considerations today.
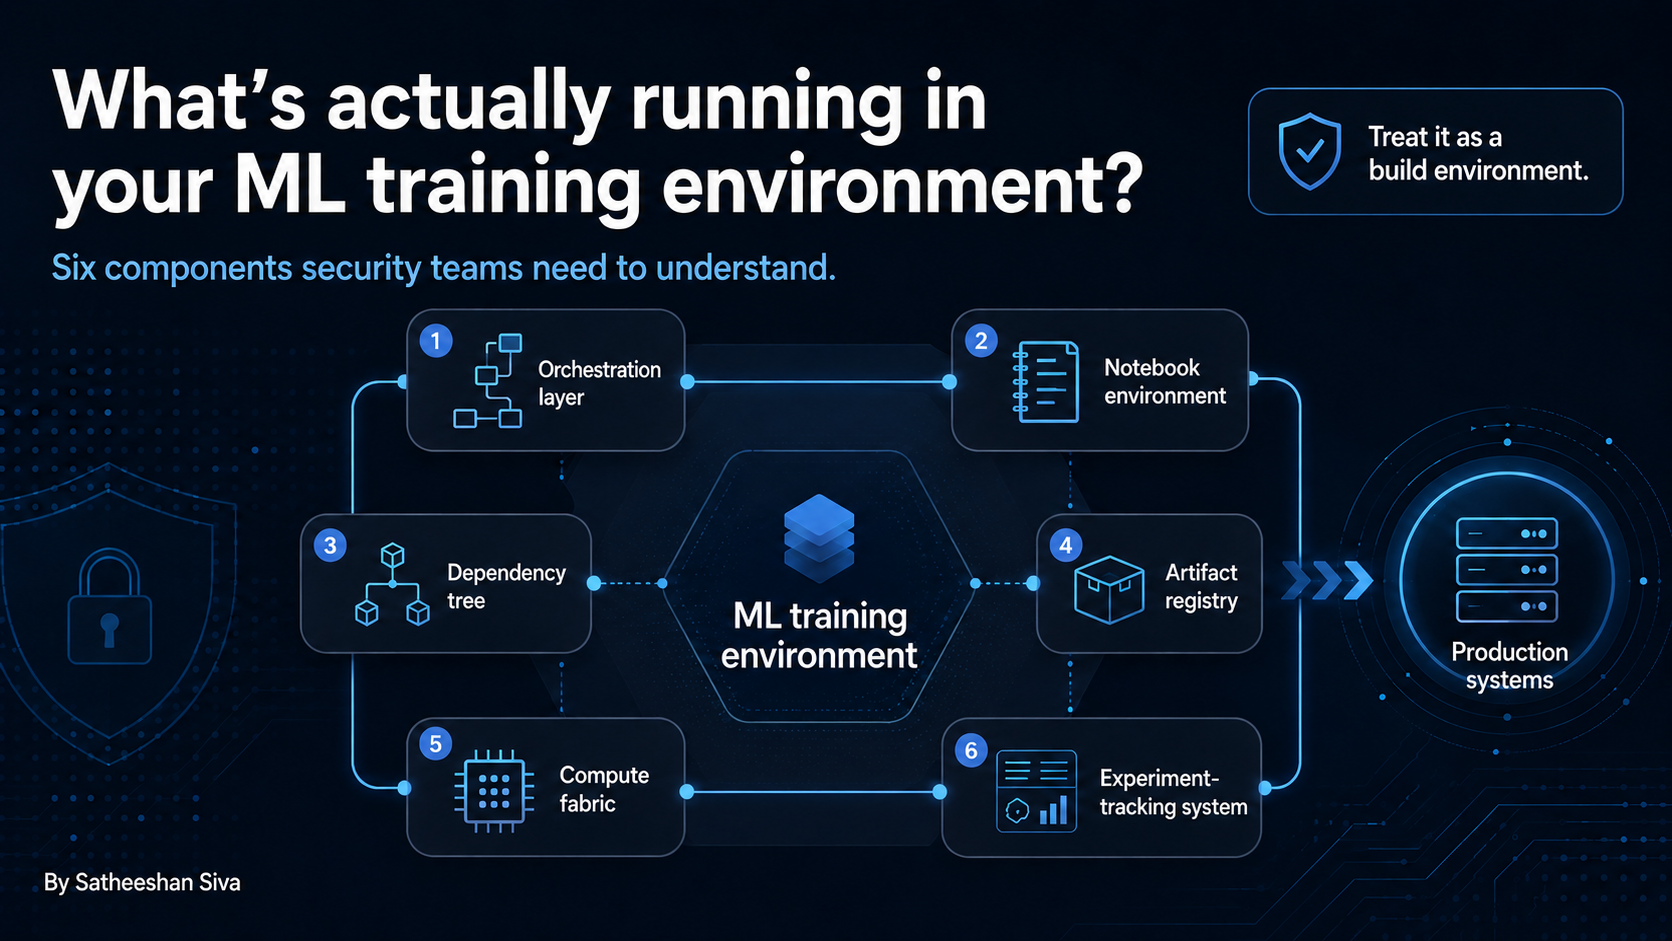
Look at a typical Machine Learning (ML) platform and you will commonly find these six components:
1. Orchestration layer
Airflow, Kubeflow, Metaflow, Prefect, and any tools leftover from your last platform reorganisation.
The orchestrator is what schedules jobs, executes your code and holds secrets. It may also hold credentials for data stores, compute environments and artifact registries.
Functionally, it is part of your build pipeline – a CI/CD system.
The question to ask your teams here is whether the orchestration layer has the same controls as a build pipeline component elsewhere. Meaning controls for managed secrets, restricted service identities, controlled changes and an audit trail.
Often the answer is “no”, because it was onboarded to your organisation through the data or analytics budget rather than the engineering function.
2. Notebook environment
Think Jupyter or one of its hosted equivalents. This is where much of your experimentation happens.
A notebook is an interactive execution environment with access to data and the ability to run arbitrary code. Alarmingly, for many teams, installing a package directly from a public repository is common practice. Think about that for a second.
Also, notebooks have persistence. That means that the analysis someone ran a while back may still be there. That includes output cells containing samples of the data that was analysed. Think about that one too.
What this means is, in practice notebooks could be one of your least-controlled locations in which customer data is stored.
3. The dependency tree
PyTorch or TensorFlow, CUDA libraries, transformers, datasets, tokenizers and all of your transitive dependencies that have been selected by different team members.
Training images often carry larger and more specialised dependency graphs than conventional application containers. Yet, they do not always pass through the same package approval, vulnerability management and build-provenance controls.
That leaves an all too familiar software supply-chain risk inside an environment that is likely not governed as software delivery.
4. Artifact registry
This is where checkpoints, weights, adapters and other training outputs are stored.
Two questions to ask your teams here:
- Who can write to it?
- What verifies that the artifact produced by an approved training job is the same artifact later promoted or deployed?
In many environments, the main basis for trust is that the file came from its expected bucket or registry.
5. Compute fabric
The GPUs or other accelerators on which training jobs run.
They may be dedicated, shared internally, or provided through your managed cloud capacity. To add to this, regions may have been selected according to GPU availability rather than the organisation’s preferred data-residency model.
This means that security teams should understand the tenancy model, job isolation, privileged access, persistent storage and your provider’s sanitisation guarantees between workloads.
These are infrastructure questions, but they are easily missed when the platform is described only as an ML service.
6. Experiment-tracking system
MLflow, Weights & Biases or a similar service, recording runs, parameters, metrics and artifacts.
An area of risk to consider here is about your data.
Why? Teams sometimes record prompts, input examples, outputs or other samples to help debug experiments.
The tracking system can therefore accumulate a rolling sample of sensitive data. It may also be externally hosted and broadly accessible across the data science team. All without being classified as a repository of customer information.
Treat it as a build environment
This analogy isn’t for its accuracy, but for it’s usefulness:
- Orchestration performs part of the CI function
- Notebooks are development environments
- Dependencies form a software supply chain
- The artifact registry is a binary repository
- GPU workers act as build infrastructure
- Experiment tracking records the build process and its outputs
AppSec and platform teams already have controls for much of this problem: protected build pipelines, workload isolation, dependency scanning, artifact provenance, signing, secrets management and controlled promotion.
The problem is that those controls are often applied unevenly to ML platforms.
These environments historically sat closer to analytics, where people examined data and produced reports. They now produce executable artifacts that can influence decisions, automate actions and be promoted into customer-facing systems.
Your control model has likely not caught up with that change.
One question for your platform team
“If someone compromised our ML orchestrator, what could they change?”
Data theft is one possibility, but it is not the only one.
Could they modify the training code? Change the source data? Write a different artifact to the registry? Alter which checkpoint is promoted? Inject a compromised dependency?
If the answer to any of those is yes, your ML platform is a path to production.
And if so, it should be controlled accordingly.
That is more actionable than starting with a request for “AI security tooling”. Much of the required control capability may already exist elsewhere in the organisation. Your immediate job is to determine whether it has been updated to cover this path already.